A Profile of Coronavirus and the Latino Workforce
COVID-19 has exposed the inequalities and conditions of the economy's backbone.
Bottom line, the US economy can't recover form the COVID-19 devastation without the recovery of US Latinos who have been the engine of the economy without the luxury of being able to work from home, who are on the front lines of the battle against the disease, who have been laid off or had their work hours cut, and many of whom have no health insurance.
It's a pithy read, but well worth your time.
*This article was originally published in the NALCAB Blog.
Over the last month, the Coronavirus pandemic has ravaged the lives and well-being of all Americans. It has disproportionately impacted the most vulnerable among us—people of color, the poor, immigrants, people who are not U.S. citizens, older individuals, and those with existing health illnesses.1 There is relatively little information on the impact of the Coronavirus and the Latino workforce. Still, a Reuters/Ipsos poll conducted between March 18 and 24 finds that about one in six Latinos “were either infected; had contact with someone infected; or knew someone infected in their extended social network” compared to about one in 11 whites.2 Further, a recent report from the Pew Research Center indicates that the Coronavirus has hit Latinos particularly hard with approximately half reporting that they or someone in their home has taken a pay cut or been laid off from or lost their job.3
As we prepare to help Latinos recover from the devastation of the Coronavirus, we will need information on the characteristics of the Latino workforce. This analysis uses census data to develop a profile of Latino workers.4 This information will be vital in understanding Latino workers in the midst of the pandemic and subsequently as the nation
begins the recovery phase.
Latino Workforce Growth
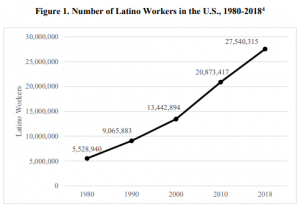
Over the last four decades, the Latino workforce has grown tremendously, increasing five-fold from 5.5 million workers in 1980 to more than 27.5 million in 2018 (Figure 1). During the 21st century, the number of Latino workers more than doubled between 2000 and 2018 from 13.4 million to 27.5 million. Over the last eight years, while the rate of increase has been brisk, it has been somewhat slower than the earlier decade due to a major decline in immigration from Mexico.5
Throughout the 21st century, Latinos have represented the largest share of the U.S. growth in its workforce, accounting for 52% of the total expansion between 2000 and 2018. More recently, with an increase of 6.7 million workers between 2010 and 2018, Latinos made up the largest portion (37%) of the 17.8 million workers that the nation added to its workforce during this period. Other groups were responsible for a smaller percentage share of the national growth: whites, 22%; African Americans, 19%; Asians and Pacific Islanders, 14%; and all others for 8%.
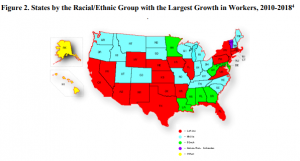
Yet, the significance of Latinos in the growth of the overall workforce is widespread across the country. Latino workers increased in all states between 2010 and 2018 while white workers declined in a dozen states. Latino growth represented the largest segment of the overall increase of the workforce in 20 states with white gains being the greatest in another 20 states (Figure 2).
The largest absolute growth of Latino workers between 2010 and 2018 took place in California (1.5 million), Texas (1.2 million), and Florida (906,000). The number of Latino workers rose by more than 100,000 in 12 other states: Arizona (292,000), New York (240,000), New Jersey (206,000), Illinois (185,000), Colorado (164,000), Pennsylvania (161,000), Washington (154,000), Massachusetts (147,000), Nevada (121,000), North Carolina (118,000), Georgia (106,000), and Virginia (102,000).
Latinos are a Rising Share of the U.S. Workforce
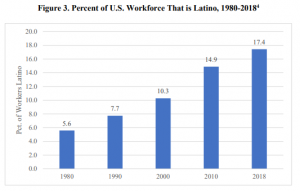
Over the last four decades, Latinos have represented a growing segment of the nation’s workers. The U.S. workforce that is Latino has risen from 5.6% in 1980 to 10.3% in 2000 and to 17.4% in 2018 (Figure 3). Latino workers comprised a larger percentage of the workforce of nine states than they accounted for nationally: New Mexico, 47.1%; California, 37.5%; Texas, 37.5%; Arizona, 30.8%; Nevada, 29.0%; Florida, 28.3%; New Jersey, 20.3%; Colorado, 19.5%; and New York, 17.8%.
Latinos Work in All Occupations, Particularly in Certain Ones
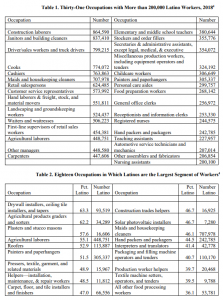
Even though Latinos are found across all 525 occupations that the Census Bureau uses to determine the types of work performed by employed individuals, they are particularly clustered in certain occupations. For example, there were more than 400,000 Latino workers nationally in each of 15 occupations in 2018 (Table 1), accounting for slightly more than one-third of all Latino workers: construction laborers (865,000); janitors and building cleaners (837,000); drivers/sales workers and truck drivers (799,000); cooks (774,000); cashiers (764,000); maids and housekeeping cleaners (708,000); retail salespersons (624,000); customer service representatives (574,000); hand laborers and freight, stock, and material movers (552,000); landscaping and groundskeeping workers (524,000); waiters and waitresses (506,000); first-line supervisors of retail sales workers (454,000); other agricultural workers (herein referred to simply as “agricultural laborers”) (449,000); other managers (a residual category of managers) (449,000); and carpenters (448,000). Over 200,000 Latino workers are also found in 16 additional occupations, ranging from nursing assistants (200,100) to elementary and middle school teachers (380,644). Overall, half of all Latino workers are in this group of 31 occupations.
The 31 occupations are primarily part of five broad categories of occupations: service occupations (9 occupations); transportation and material moving occupations (4); office and administrative support occupations (4); construction and extraction occupations (3); and sales and related occupations (3).
Moreover, while Latinos represent 17.4% of all U.S. workers, there are many occupations where they comprise a higher percentage of persons working in these types of jobs. Indeed, Latinos make up at least 25% of employees in 74 occupations. Yet, Latinos are the largest segment of the workforce of 18 occupations (Table 2). More than half of
workers in six occupations are Latino: drywall installers, ceiling tile installers, and tapers (63.3%); agricultural products graders and sorters (62.2%); plasters and stucco masons (57.6%); agricultural laborers (55.1%); roofers (52.9%); and painters and paperhangers (51.5%). Latinos also outnumber workers from all other groups in an additional 12
occupations. The 18 occupations fall principally in three broad occupational categories: construction and extraction occupations (7), production occupations (5), and farming, fishing, and forestry occupations (2).
In the Coronavirus era, many of the types of jobs where Latinos are clustered require people to carry out their duties in the specific workplace rather than from home. Economists Elise Gould and Heidi Shierholz estimate that “less than one in five black workers and roughly one in six Hispanic workers are able to work from home.”6
Thus, as New York Times columnist, Charles Blow, observes sheltering-in-place and social distancing are not privileges for many workers of color.7
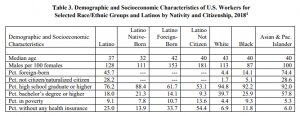
Demographic and Socioeconomic Characteristics of Latino Workers Latino workers stand out demographically and socioeconomically from their counterparts in the other three largest racial/ethnic groups in the country. For example, Latino employees are likely to be younger and to be more male compared to white, black, and Asian and Pacific Islander workers (Table 3). Furthermore, even though Asian and Pacific Islander (74.4%) workers are much more likely to have been born outside of the U.S. compared to Latinos (45.7%), an equal percentage (roughly 28%) of all Latinos and Asians and Pacific Islanders are not U.S. citizens. Moreover, Latino workers have the lowest educational level (76% are high school graduates) and highest percentage without any healthcare insurance (23.0%). Finally, Latino and black workers are more than twice as likely as whites to be poor.
Yet, however, there is much variation among Latinos on the basis of nativity status and citizenship status. In particular, Latinos born outside of the United States fare worse socioeconomically than those born in the United States. Nonetheless, Latinos who are not U.S. citizens, a group that represents 28% of all Latinos in the country, are the most vulnerable socioeconomically with the lowest level of education (only 53% are high school graduates), highest poverty rate (14%), and the most likely not to have health insurance (54%). It is important to acknowledge that persons who are not U.S. citizens include not only unauthorized workers, but also those who are permanent residents or who are authorized to be in the country.
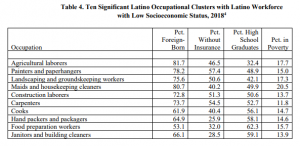
The profile associated with foreign-born status, low educational level, lack of healthcare insurance, and high levels of impoverishment reflects many of the Latino workers in certain occupations in which they are clustered. Table 4 provides demographic and socioeconomic characteristics for the ten occupations having more than 200,000 Latino workers and in which Latinos account for at least 25% of all workers doing this type of job. The majority of workers in each of the occupations was born outside of the U.S. with more than three-fourths foreign-born among agricultural laborers (81.7%), maids and housekeeping cleaners (80.7%), painters and paperhangers (78.2%), and landscaping and groundskeeping workers (75.6%). In addition, overall large portions of workers in the ten occupations lack healthcare insurance, but especially those in five occupations: painters and paperhangers (57.4%), carpenters (54.5%), construction laborers (51.3%), landscaping and groundskeeping workers (50.6%), and agricultural laborers (46.5%). Furthermore, workers across the ten occupations have relatively low levels of education with less than half of workers in four occupations being high school graduates: agricultural laborers (32.4%), landscaping and groundskeeping workers (42.1%), painters and paperhangers (48.9%), and maids and housekeeping cleaners (49.9%). Finally, overall Latino workers in the ten occupations have relatively high poverty rates, especially in the case of maids and housekeeping cleaners (20.5%),
agricultural laborers (17.7%), and landscaping and groundskeeping workers (17.3%).
Conclusions
The analysis carried out in this blog clearly shows that overall Latinos have represented the engine of the U.S. economy. Job growth over the last several decades has been largely due to Latinos and this has been particularly the case in the 21st century.
Still, Latinos have lagged behind socioeconomically in various respects with persons born outside of the United States and especially those who do not have U.S. citizenship being particularly vulnerable. The Coronavirus pandemic has clearly exposed these inequalities and the perilous conditions of many Latinos. Indeed, the Coronavirus outbreak has already weathered and will increasingly tatter the fragile safety net that makes it difficult for many people on the margins to sustain themselves. Many Latinos, labelled as essential workers, now are on the frontlines of the pandemic caring for the sick as well as providing the most basic necessities for communities and the country to continue to function. Many Latinos, as is the case with other people of color and the poor, do not have the luxury to be able to work from home or to shelter-in-place. Many Latinos continue to toil in hospitals, care for the aged, construct homes and buildings, package products, stock shelves of grocery stores, as well as pick fruits and vegetables to put on our tables. In the process, they are putting themselves at risk of contracting and succumbing to the Coronavirus. Many other Latinos have also taken pay cuts or have been laid off or lost their jobs. Particularly challenging will be the health and economic sustainability of those without access to healthcare insurance, unemployment benefits, housing assistance, and the one-time maximum of $1,200 check coming out of the $2 trillion Coronavirus stimulus bill.
It is clear that right now things will only get worse with respect to infections and deaths associated with the Coronavirus and the state of the economy over the coming months and years. As Latinos have been particularly instrumental as the engine of the U.S. economy, they will play a major role in building back that economy. However, as is the case with many other groups around the country, Latinos will need major assistance to recover from the maladies of the Coronavirus pandemic.
Rogelio Sáenz is professor in the Department of Demography at the University of Texas at San Antonio. He is co-author of the book “Latinos in the United States: Diversity and Change.” Sáenz is a regular contributor of op-ed essays to newspapers throughout the country. He can be reached at rogelio.saenz@utsa.edu and on Twitter at @RogelioSaenz42.
Endnotes
1 Ibram X. Kendi, “What the racial data show,” The Atlantic (April 6, 2020).
https://www.theatlantic.com/ideas/archive/2020/04/Coronavirus-exposing-our-racial-divides/609526/.
2 Maurice Tamman, “How many Americans have Coronavirus? New Reuters poll might offer a hint,” Health News (March 26, 2020).
https://www.reuters.com/article/us-health-Coronavirus-proximitypoll/how-many-americans-have-Coronavirus-new-reuters-pollmight-offer-a-hint-idUSKBN21D2XJ.
3 Jens Manuel Krogstad, Ana Gonzalez-Barrera, and Luis Noe-Bustamante, “U.S. Latinos among Hardest Hit by Pay Cuts, Job Losses
Due to Coronavirus,” Pew Research Center FACTTANK (April 3, 2020). https://www.pewresearch.org/fact-tank/2020/04/03/u-slatinos-among-hardest-hit-by-pay-cuts-job-losses-due-to-Coronavirus/.
4 Data from the 1980, 1990, and 2000 Public Use Microdata Sample and the 2010 and 2018 American Community Survey 1-Year
Estimates public use files are used in the analysis. The data files were accessed online from IPUMS at the University of Minnesota
(https://usa.ipums.org/usa).
5 Rogelio Sáenz, “Far fewer Mexicans are coming to the US—and those who do are more educated,” The Conversation (Sept. 29,
2019).
6 Elise Gould and Heidi Shierholz, “Not everybody can work from home,” Economic Policy Institute Working Economics Blog
(March 19, 2020). https://www.epi.org/blog/black-and-hispanic-workers-are-much-less-likely-to-be-able-to-work-from-home/.
7 Charles M. Blow, “Social distancing is a privilege.” New York Times (April 5, 2020).