Mapping the Nation’s Latino Population: by State, County and City
*If a dive into Latino population maps makes your day, then I have nothing to add to this. The population growth by county map is fascinating. VL
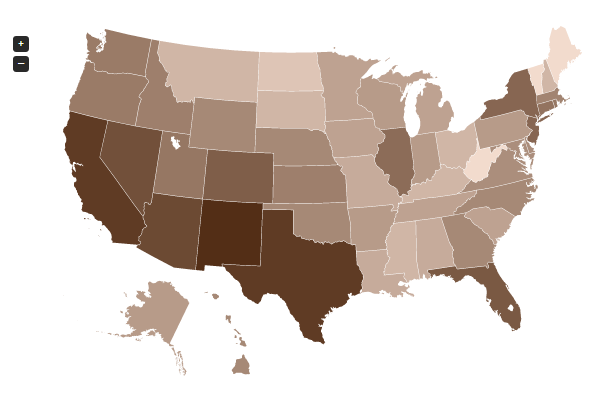
The Pew Research Center’s Hispanic Trends Project annually produces reports, databases and interactive maps showing the current geographic concentration of Hispanics throughout the U.S. and how that distribution has changed since 1980. These maps and databases are largely based on the most recent data from the U.S. Census Bureau’s American Community Survey. Accompanying these maps are statistical profiles of the Hispanic population in each of the 50 states and the District of Columbia along with statistical profiles of the Hispanic population in the 60 largest metropolitan areas.
Click HERE to read the full story.
[Photo courtesy of Pew Hispanic Project]